
This English guide is shared with our global site. Follow related UK service links for current packages. Other service links open the global catalog in its stated currency.

Facebook audience and engagement measurement map
| Measure | What it helps describe | Keep separate from |
|---|---|---|
| Followers | People connected to a Page or eligible public profile | Page likes, reach, and post reactions |
| Reach | Accounts shown content during the selected reporting period | Follower total and video play count |
| Reactions, comments, shares | Visible responses to a particular post or group of posts | Page-level audience size |
| Video views and watch time | Counted plays and accumulated viewing attention | Reactions and follower growth |
| Clicks and Page actions | Steps people took after encountering the Page or content | Public engagement totals |
| Business outcomes | Qualified enquiries, bookings, leads, or purchases recorded elsewhere | Platform metrics unless attribution is documented |
Start with the job of each metric
A follower count belongs to a Facebook Page or to a profile where public following is available. It describes how many accounts are connected to that destination under Facebook's current definitions. It does not tell you how many followers saw the latest post, watched a video, remembered an offer, or became customers. Meta's help material describes following as a way to receive public updates, but distribution still depends on each person's settings and Facebook's systems.
Engagement is a broad reporting word rather than one universal Facebook number. A team may use it to mean reactions, comments, and shares; another may add link clicks, photo views, or other actions. Video reporting adds views and watch time, which describe exposure and attention rather than the same behavior as a reaction. Write down the measures included whenever the word engagement appears in a report.
Reach answers another question: how many accounts were shown content during a selected period under the platform's reporting rules. A person may be reached without following the Page, and a follower may not be reached by every post. Start analysis by putting followers, reach, content interactions, video attention, Page actions, and business results in separate rows. They can be read together without being treated as interchangeable.
Choose the decision before choosing the numbers
A useful report begins with a decision, not with every figure available in a dashboard. A Page manager may need to decide which topic deserves another post, whether a recurring video series is holding attention, or whether the Page introduction and action button make sense for new visitors. Each question needs a smaller set of evidence. Collecting dozens of unrelated totals often creates a busy report without a clear next step.
Turn a vague objective into a review question. Instead of asking whether the Page is growing, ask whether the follower total increased during the four weeks in which a new educational series was published. Instead of asking whether engagement improved, ask whether posts in that series earned more comments and shares per reached account than similar posts from the previous period. The narrower wording exposes what must be measured and what remains uncertain.
Keep commercial decisions equally specific. A followers package applies to an eligible Page or public profile audience count. A Page likes package concerns the Page-level like metric, and post likes concern one public update. Video views and watch hours have their own destinations and units. Decide which visible number matters before opening a package page, then evaluate any order separately from the content and business outcomes around it.
Build a baseline another person can reproduce
Record the exact public Page or eligible profile URL, the displayed follower count, and the date and time of the observation. If Page likes are relevant, save them in another field. For content, keep the direct URL of every post or video reviewed. A Page home address and an individual content address serve different purposes, so a spreadsheet should never use one generic Facebook link for every metric.
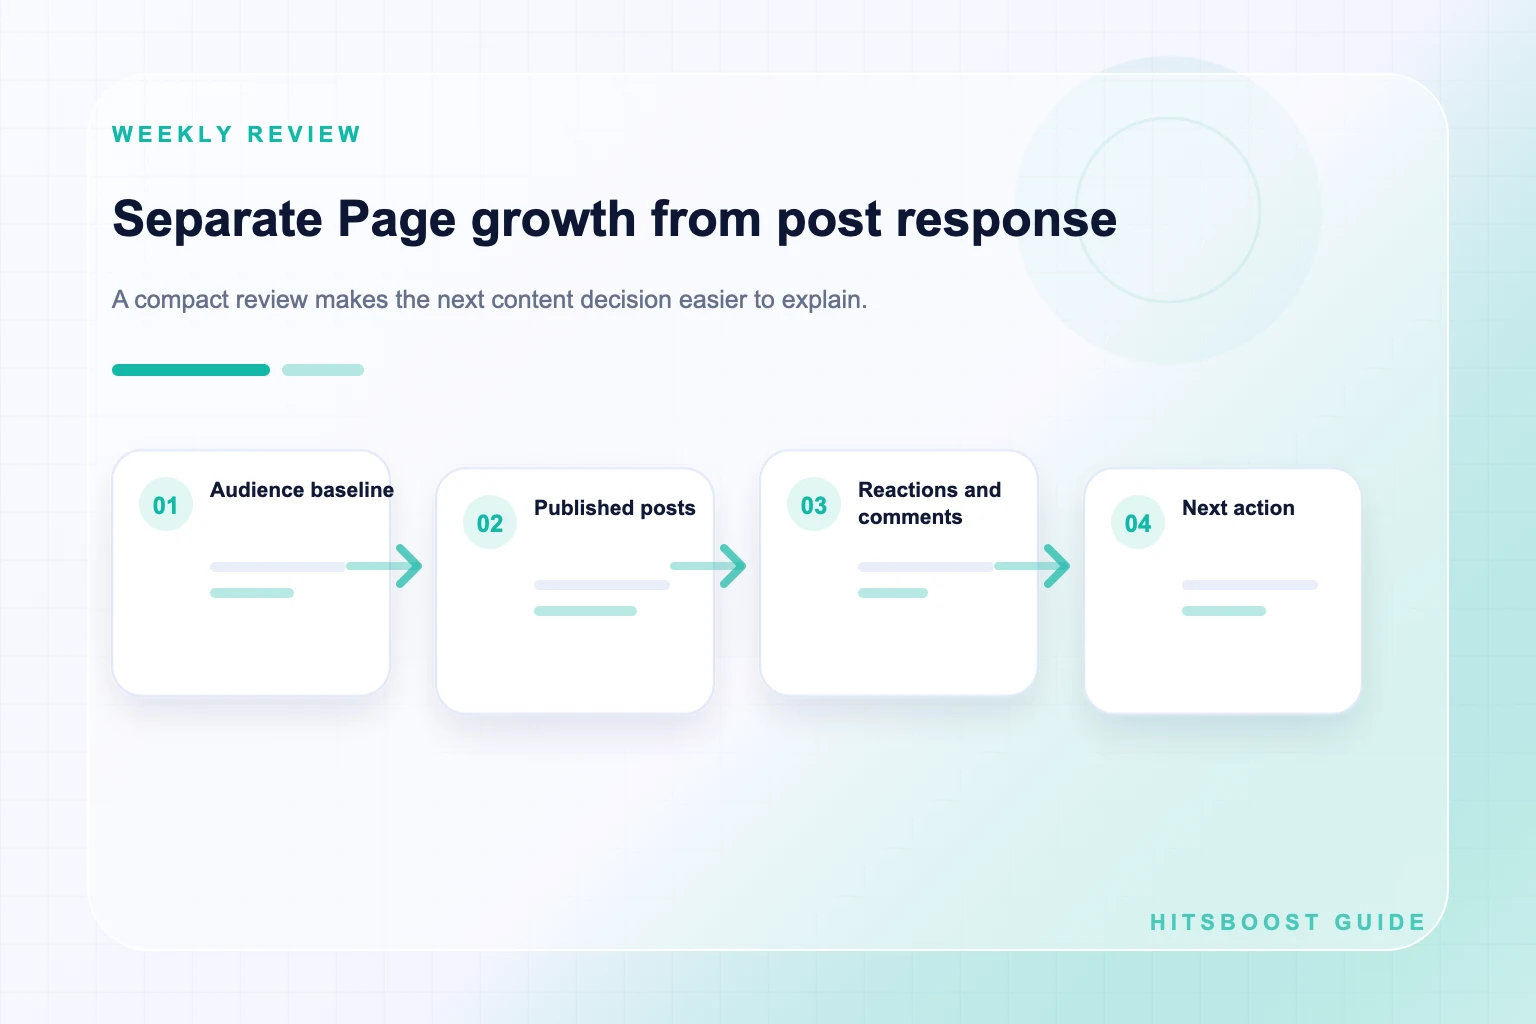
Define the reporting window before examining performance. A weekly review can help a small publishing team maintain rhythm, while a monthly view reduces the temptation to react to every daily movement. Use the same timezone and the same available reporting surface when possible. Mark a figure as public display, Page insight, export, or manually calculated so a teammate knows where it came from and can repeat the method.
Add context beside the baseline. Note publishing frequency, content formats, advertising, email promotion, collaborations, live events, third-party packages, Page changes, and major offers. These details do not prove why a number moved. They prevent the report from presenting the metric as if nothing else happened. If a baseline is missing, begin one now rather than reconstructing an exact historical figure from memory.
- Save the exact Page or profile URL and the name of the reporting view.
- Record the start and end date, timezone, and whether each number is a total or a period change.
- List every post, video, advertisement, email, collaboration, or package active during the period.
- Keep screenshots or exports with the written report instead of relying on memory.
Calculate an engagement rate without hiding the formula
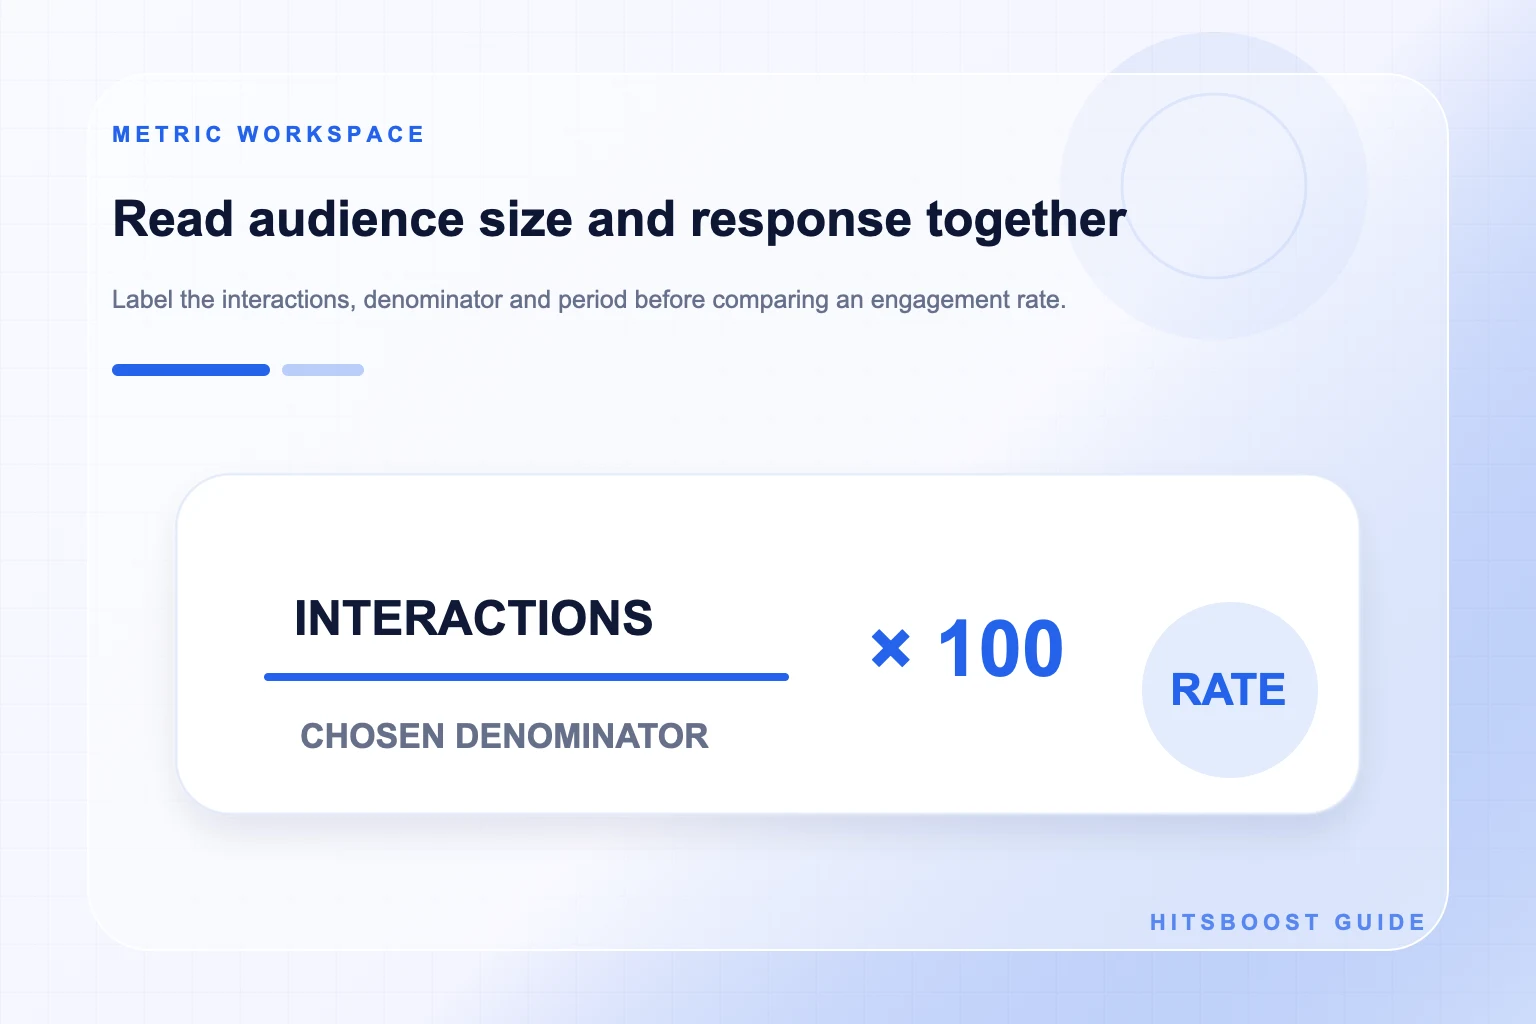
An engagement rate is selected interactions divided by a chosen reference number, usually expressed as a percentage. The calculation is not self-explanatory. Reactions plus comments plus shares divided by reach answers a different question from the same interactions divided by followers. Adding clicks changes the numerator again. Put the complete formula beside the result instead of labeling all of these percentages as engagement rate.
For example, suppose a post records 60 reactions, 12 comments, and 8 shares. The selected interaction total is 80. If the post reached 4,000 accounts, the interactions-per-reach calculation is 2 percent. If the Page has 10,000 followers, the interactions-per-follower calculation is 0.8 percent. Neither figure is a universal quality score, and the difference does not mean the dashboard is wrong; the denominators describe different reference groups.
Use the HitsBoost engagement rate calculator to check the arithmetic, then retain the original counts with the result. Do not compare your percentage with an industry benchmark unless the benchmark uses the same interaction set, denominator, platform surface, and date range. A consistent internal calculation across comparable posts is usually more useful than a broad average assembled from accounts with different audiences and publishing practices.
- Interactions per follower = selected interactions divided by follower count, multiplied by 100.
- Interactions per reach = selected interactions divided by reach, multiplied by 100.
- Post average = total selected interactions divided by the number of posts reviewed.
- Never compare two percentages until their numerators, denominators, and time windows match.
Compare content with a fair comparison set
Compare posts that had a reasonably similar job. A product launch video, a customer-service notice, a community question, and a hiring announcement may invite very different behavior. Group content by topic, format, length, audience, and distribution before comparing rates. If one post was advertised or included in an email while another relied only on normal Page distribution, record that difference rather than treating the two conditions as identical.
Look at several posts and several periods. One unusually strong or weak update can distort an average, especially on a Page that publishes infrequently. Median performance can be helpful when a single post is an outlier, while the range shows how widely results vary. The aim is not to manufacture a perfect experiment. It is to make the limitations visible and avoid building a content strategy around one lucky result.
Read the post itself alongside the numbers. Review the opening line, image or first video frame, clarity of the offer, relevance to the intended audience, and the action requested. Comments can reveal whether people understood the message, asked useful questions, or arrived for an unrelated reason. Quantitative comparison identifies where to look; the content and conversation help explain what to improve next.
Read reactions, comments, shares, views, and watch time separately
A reaction is a lightweight response to one item. A comment may show a question, opinion, objection, or conversation, but its value depends on what the person actually wrote. A share may extend distribution, yet it does not guarantee that the receiving audience opened or acted on the post. Count each action separately before combining any of them, and sample the substance of comments instead of treating every response as equal.
Video adds a second measurement layer. Views describe qualifying plays under the rules used for that Facebook surface, while watch time describes accumulated viewing duration. Average watch time or retention information can help a team inspect the opening, pacing, and length. A video can gather many starts but little sustained attention, or fewer starts with stronger viewing depth. Neither pattern is captured by the reaction count alone.
Match any optional service to the same distinction. A post likes package points to one public post. A video views package points to one eligible video and its view count. A watch hours service addresses viewing duration under its stated terms. Buying one unit does not include the others unless the live package explicitly says so, and no package guarantees comments, shares, follower growth, recommendations, enquiries, or revenue.
Connect audience growth with content response carefully
Plot follower count over time and place publishing or campaign events on the same timeline. This can reveal useful sequences: a guide was published, a collaboration sent visitors, and the Page then recorded a higher net follower change. The timeline supports a question worth investigating. It does not prove that everyone who followed came from that guide or that the same action will produce the same result next month.
Avoid reverse assumptions as well. A larger follower total does not require every post to receive more reactions, because distribution, topic, format, timing, and audience interest can change. A high-performing post can reach people beyond the current follower base without producing a matching increase in followers. State both observations and keep the bridge between them as a hypothesis unless referral or attribution evidence supports more.
Use clearer language in reports: 'Follower count increased by X during the period' and 'The three tutorial posts received Y selected interactions from Z reach.' Then add, 'The activity occurred in the same period, but this report cannot identify how many follows resulted from those posts.' Honest limits make the analysis more trustworthy and give the next campaign a better measurement question.
Create a monthly scorecard that serves the Page goal
Organize the scorecard in layers. The audience layer holds followers and Page likes. The exposure layer contains reach and views. The response layer contains reactions, comments, shares, and clicks. The attention layer includes watch time or retention information. The action layer records messages, action-button use, website visits, bookings, leads, or purchases when your systems can document them. This structure prevents one large public total from dominating the entire review.
For each layer, show the current period, a comparable earlier period, and a short note about the content or campaign conditions. Use totals for volume and rates only where the formula adds meaning. For a small number of important posts, add direct URLs and a one-sentence qualitative observation. Keep unattributed business outcomes separate from platform results rather than implying that Facebook caused every enquiry received during the month.
End the scorecard with decisions. Continue one content pattern that answered the Page's goal, change one weak element, and stop one activity that consumed effort without useful evidence. Assign an owner and a review date. A scorecard earns its place when it changes what the team does next; it should not become a monthly archive of colorful numbers nobody uses.
Diagnose a weak result before changing everything
When follower growth is quiet, first verify the destination and the same follower metric. Check whether the Page promise is clear, whether recent posts match that promise, and whether people can find the Page from owned channels. Review a longer period before treating a few flat days as a trend. If the count dropped, document the change and consult the separate follower-count investigation guide rather than guessing at a cause.
When reach is present but response is low, inspect audience fit and the post itself. The opening may be unclear, the creative may not communicate on a small screen, or the requested action may require too much effort. When reactions are present but clicks or enquiries are weak, inspect the offer, Page information, destination page, and tracking. Do not try to repair every layer by simply asking for more reactions.
When video views are present but watch time is weak, examine the first moments and the point where attention declines in the insights available to the Page. Test a clearer opening, faster demonstration, shorter setup, or more accurate title. Change one major element at a time when practical. A diagnosis should produce a testable next edit, not a vague instruction to post more or blame the algorithm.
Use follower or engagement packages with realistic boundaries
A package should be evaluated against its written scope: metric, quantity, eligible public destination, price, timing language, and support terms. Verify the Page, profile, post, or video link before checkout and never provide a personal Facebook password or login code for a public destination. Save the selected option, baseline, receipt, and order reference so the transaction can be reviewed without relying on memory.
Report the package result separately from organic and paid content performance. A delivered follower count does not show that those accounts saw a post. A post-like count does not establish reach, watch time, or customer intent. A video-view order does not prove that viewers completed the video. Preserve those boundaries even when several activities support the same launch, because clear reporting protects both the customer and the team.
Use package pages as optional service references rather than as conclusions to every analysis. If the immediate need is a stronger Page and content plan, complete that work first. If the team chooses a package, select the one whose unit and destination match the stated objective. Avoid guarantees about ranking, permanence, customer acquisition, or revenue, since those outcomes depend on factors outside the selected count.
- State what changed and the exact source of each figure.
- Describe other campaign or publishing activity that occurred during the period.
- Separate observations from possible explanations and from facts you cannot confirm.
- Choose one next action, an owner, and a date for the next review.
Turn the review into one better next step
Write a short conclusion that distinguishes fact, context, interpretation, and action. A useful example is: 'Follower count rose during the month; tutorial posts earned the highest share rate among the six posts reviewed; an email and collaboration also promoted the Page; next month we will test two tutorials with clearer calls to save or visit the website.' This communicates what was observed without claiming a cause the data cannot establish.
Choose a review rhythm the team can maintain. Weekly checks can catch operational issues and record content context. Monthly reviews are better for comparing patterns and making larger decisions. Quarterly reviews can assess whether the Page still supports business priorities. Keep the definitions stable across periods, and document any reporting or interface change that prevents a direct comparison.
The purpose of reading followers and engagement together is not to force them into one score. It is to understand the audience connection, the content people encountered, the response they gave, and the useful action that followed. A disciplined report leaves the team with a clearer question and a manageable experiment rather than a claim that one count explains the whole Page.
Frequently asked questions
Are Facebook followers and engagement the same thing?+
No. Followers describe an audience connection to a Page or eligible public profile. Engagement is a reporting label for selected content actions such as reactions, comments, shares, or clicks. Always state which actions are included.
What is a good Facebook engagement rate?+
There is no universal rate that fits every Page, format, audience, and formula. Compare your own similar content using the same numerator, denominator, and period, and use external benchmarks only when their method matches yours.
Should engagement rate be divided by followers or reach?+
Both calculations can be useful, but they answer different questions. Dividing selected interactions by followers references the Page audience; dividing by reach references accounts shown the content. Label the denominator and avoid comparing unlike formulas.
Can a Page have more followers but lower post engagement?+
Yes. Followers, distribution, and response are separate. Publishing frequency, topic, format, timing, audience interest, and Facebook's systems can all affect a post. Review several comparable posts before deciding that a pattern exists.
Do Facebook video views count as engagement?+
Some reports may group views with engagement, while others keep them under exposure or video performance. The clearest approach is to report views, watch time, reactions, comments, and shares separately, then define any combined total you create.
Does buying Facebook followers increase engagement?+
A followers package addresses the follower count described in the live offer. It does not guarantee reach, reactions, comments, shares, views, enquiries, or sales. Measure the package and content performance in separate parts of the report.
How often should a small team review Facebook performance?+
Record key baselines weekly if operations require it, then conduct a fuller monthly review across audience, exposure, response, attention, and business-action layers. Use a quarterly check to confirm that the Page still supports wider goals.
Compare Facebook Followers packages.
Prepare the public destination, then review the quantity and terms that fit your goal.
Compare Facebook follower packages