
This English guide is shared with our global site. Follow related UK service links for current packages. Other service links open the global catalog in its stated currency.

One-page Facebook growth report
| Report block | Core fields | Decision it can support |
|---|---|---|
| Scope | Page URL, goal, period, timezone, owner | Confirms what and when the report covers |
| Audience | Followers and Page likes under exact labels | Shows audience-level movement without blending counts |
| Publishing | Post links, formats, topics, cadence | Shows what the Page actually produced |
| Distribution | Reach, impressions where available, paid and organic context | Shows how exposure changed under stated definitions |
| Response | Reactions, comments, shares, clicks, messages | Shows how people responded to named content |
| Viewing | Views, watch duration, completion or retention where available | Shows whether video openings and pacing held attention |
| Outcome | Qualified visits, enquiries, sign-ups, bookings, sales | Connects Page work to verified business evidence |
| Decision | Observation, limitation, next test, owner, date | Turns reporting into an accountable improvement |
Define the decision before collecting numbers
A useful report begins with a question. ‘Did the new tutorial series hold video attention better than the previous series?’ is measurable. ‘Did the Page grow?’ is too broad until the team defines audience, distribution, response, viewing, traffic, or business outcomes. Write the decision the report should support, the person who will make it, and the date by which it is needed.
Choose one primary metric that matches the decision and a small set of supporting measures. For a follower campaign, the follower count on one Page may be primary while publishing, reach, and interactions provide context. For a video revision, watch duration or retention may be primary while views and comments add perspective. A report does not become stronger simply by adding every available dashboard number.
Record the scope: Page URL, Page name, audience or market, reporting dates, timezone, data owner, and data sources. Note whether figures come from the public Page, an authorized Facebook management interface, advertising reporting, website analytics, or a customer system. Scope prevents a later reader from assuming the report covers another Page, market, or period.
- What decision will this report inform?
- Which one Page, date range, timezone, and audience are in scope?
- Which metric is primary, and which measures provide context?
- Which data sources and limitations must be named?
Create a baseline on one verified Page
Open the public Page URL and confirm the name, image, introduction, and follower context. If a business manages location Pages, legacy Pages, or similarly named campaigns, keep each destination in a separate report. Save the chosen URL rather than searching for the Page again at every checkpoint. A consistent destination is the foundation of every meaningful comparison.
Record the starting follower count and Page-like count separately where both are relevant. Add the metric labels, date, time, timezone, source, and whether the public display is rounded. If authorized insights provide a more precise value, identify that source. Do not combine a rounded public baseline with a precise private endpoint without stating the limitation.
Capture the current Page state as context: recent publishing frequency, main formats, contact path, active advertising, major campaign, and any planned rename or link change. This is not an attempt to freeze the Page. It gives the team a dated picture of the conditions under which the baseline was recorded.
Use a layered measurement framework
Organize the report into audience, publishing, distribution, response, viewing, traffic, and business outcome layers. Audience includes followers and Page likes. Publishing lists what the team released. Distribution includes reach and impressions under the current definitions. Response includes reactions, comments, shares, clicks, and messages. Viewing covers video plays and duration. Traffic and outcomes come from reliable owned systems.
The layers can influence one another, but the report should not merge them. A larger audience may create more opportunities for exposure, yet it does not guarantee any particular reach. A post may reach people who do not follow the Page. A video can accumulate views without long viewing sessions. A link can receive clicks without qualified enquiries. Each transition needs evidence rather than assumption.
Use the layer closest to the next action. If visitors cannot understand the Page, improve identity and content. If a post receives exposure but weak response, review its message and audience fit. If a video starts strongly and loses viewers early, review pacing. If Facebook activity rises but the website produces no enquiries, inspect the landing path and offer before purchasing more attention.
Measure audience change without treating it as the whole result
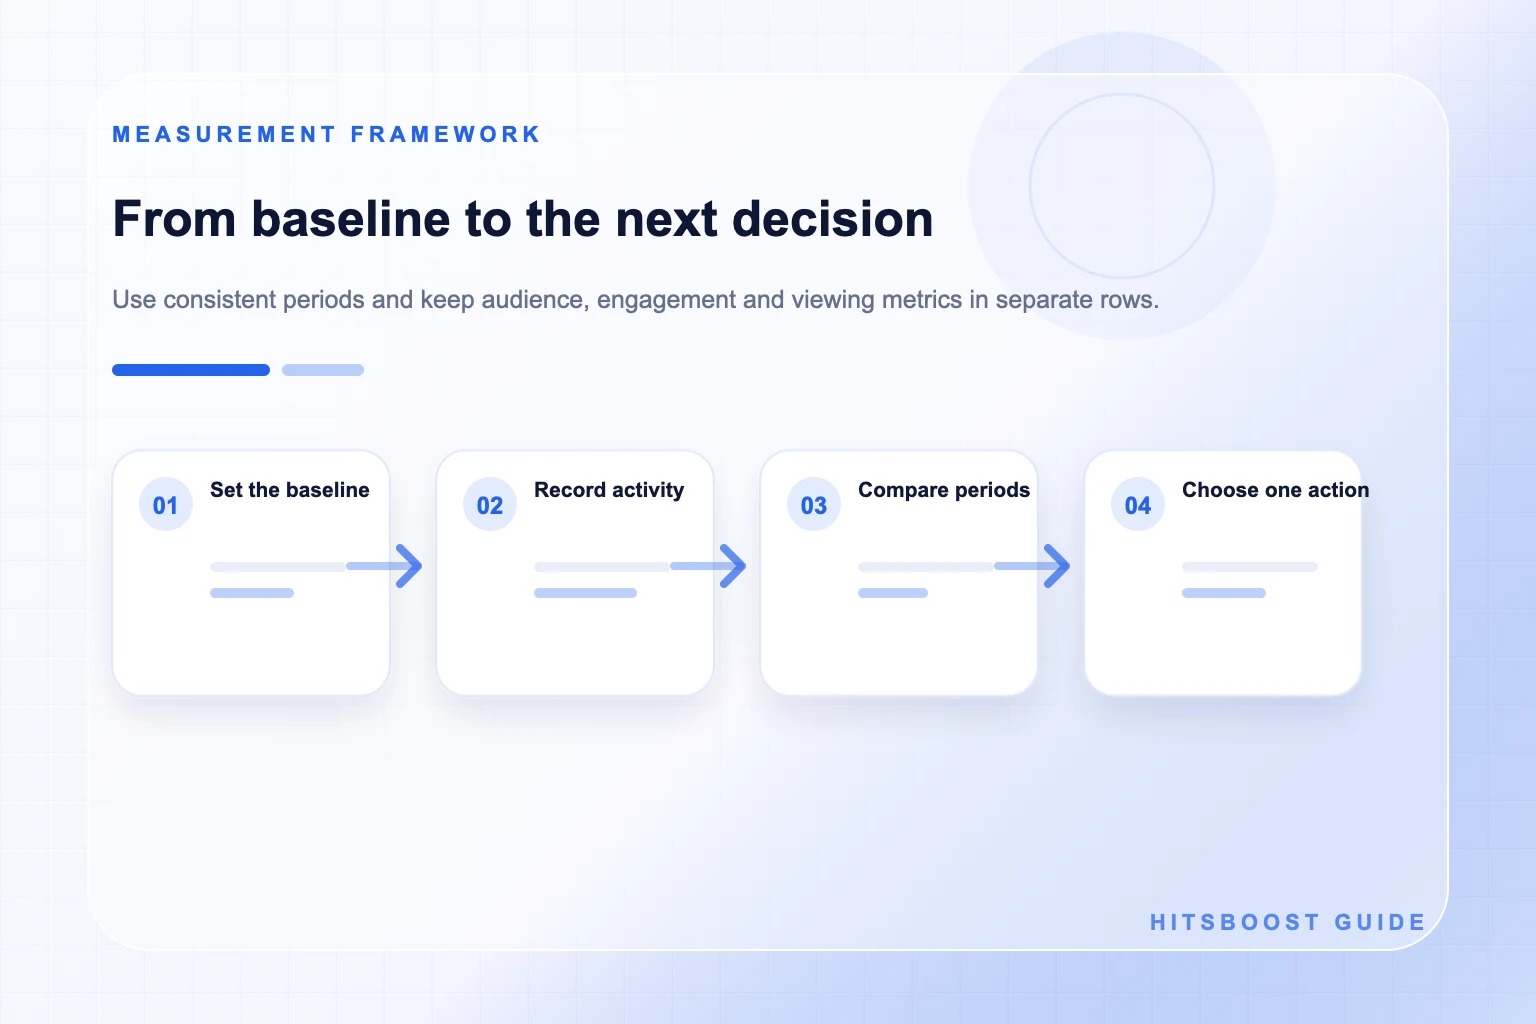
Record followers at consistent checkpoints and retain the raw starting and ending values. Net change is the end value minus the start value. Percentage change is net change divided by the start value, multiplied by one hundred, when the start is nonzero and the two values are comparable. Keep Page likes in a separate row; do not substitute them when the visible follower count is unavailable.
A net total reflects additions and losses together. People may follow or unfollow independently, accounts may become unavailable, the platform may apply enforcement, and public displays may round or update. The visible difference does not identify every account or its source. Describe the observation and avoid assigning all movement to one post, order, advertisement, or collaboration without suitable evidence.
Add quality context through behavior, not invented follower labels. Review whether content prompts relevant comments, return viewing, messages, site actions, or community participation. Do not claim that a follower is real, active, interested, or a customer solely from the total. If a provider supplies categories or delivery statuses, attribute those claims to the provider rather than presenting them as independently verified Facebook insight.
- Follower and Page-like totals under their exact current labels.
- Net change and percentage change only when starting values are known and comparable.
- Acquisition or loss detail only where the authorized interface actually provides it.
- No assumption that every new follower saw content, engaged, or became a customer.
Review publishing and content response together
List every Page post in the period with its direct link, publication time, topic, format, objective, and distribution notes. Then record reactions, comments, shares, and relevant clicks as separate values. The list prevents a busy publishing week from being compared with a quiet one as if output were identical, and it makes strong or weak results traceable to the actual content.
Read comments and messages as well as counting them. Tag recurring questions, objections, examples, praise, complaints, and support needs. A small number of detailed questions can reveal a valuable follow-up topic, while a large reaction total may offer little editorial direction. Protect personal data and report themes rather than copying private conversations into a broad team document.
If an engagement rate is useful, state its components. Interactions divided by followers answers a different question from interactions divided by reach. Save the raw numerator, denominator, date range, and included posts. Compare rates calculated with the same method and reasonably similar content conditions; otherwise, the percentage can create more confusion than the raw counts.
Measure video views and watch behavior separately
For each video, record its direct link, duration, format, publication date, objective, and relevant promotion. Capture the view measure and watch-duration or retention measures available in the current authorized interface. Meta's March 2026 creator update introduced qualified-view and related measures for the invite-only Content Monetization program, which shows why the exact context matters. Do not apply a monetization definition automatically to every Page or public view count.
Do not compare a play count directly with watch hours as if they were the same unit. Views describe qualifying plays under a displayed rule; watch duration adds time spent. Average watch time and completion introduce other denominators. A short Reel and a long live recording require different expectations, so compare similar lengths and formats or explain the mismatch.
Turn the evidence into a creative question. Did viewers leave before the promise became clear? Did an example hold attention better than a long introduction? Did captions help comprehension? Did one topic earn useful comments despite modest views? The report should guide an edit, structure, or topic decision rather than turning a view total into a general judgment about the creator or audience.
Connect traffic and business actions carefully
Define the actions that matter outside Facebook: qualified website visits, newsletter sign-ups, product views, enquiries, bookings, donations, applications, or sales. Use the owned analytics, commerce, or customer system that records them. Test Page links, campaign tags, forms, and conversion events before the period begins. If consent, browser controls, or cross-device behavior limit measurement, document the gap.
Avoid treating every direct or unattributed conversion as Facebook-driven. People may encounter the brand through several channels, return later, switch devices, or decline tracking. Attribution reports are models with rules and windows, not a complete history of each person's decision. State the selected model and use cautious language such as ‘reported’ or ‘associated’ when the system cannot establish a unique cause.
Add a qualitative outcome line. A local business may value relevant appointment questions; a creator may value partnership enquiries; a nonprofit may value volunteer interest. Verify these actions and protect personal information. A smaller number of qualified outcomes can matter more than a large attention count, depending on the Page objective.
Compare consistent periods and annotate changes
Choose complete periods with the same length and timezone, such as Monday through Sunday or calendar months. Compare reasonably similar seasons and activity levels. A thirty-day total should not be compared with a seven-day total without normalization and explanation. A post published near the end of a period has had less time to accumulate response, so use age-based comparisons when that issue matters.
Maintain an annotation timeline. Add new content series, paid campaigns, email sends, collaborations, press coverage, product launches, seasonal events, outages, policy issues, Page renames, link repairs, team changes, and optional packages. An annotation can explain why a period deserves investigation, but it does not prove that the event caused the observed result.
Use rolling averages only when they improve the decision and explain the method. Smoothing can reveal a trend, but it can also hide a sudden problem. Keep the raw weekly values available. If the Page is new or publishes irregularly, a narrative review of individual posts may be more honest than a trend line built from very little data.
Turn the report into a repeatable one-page template
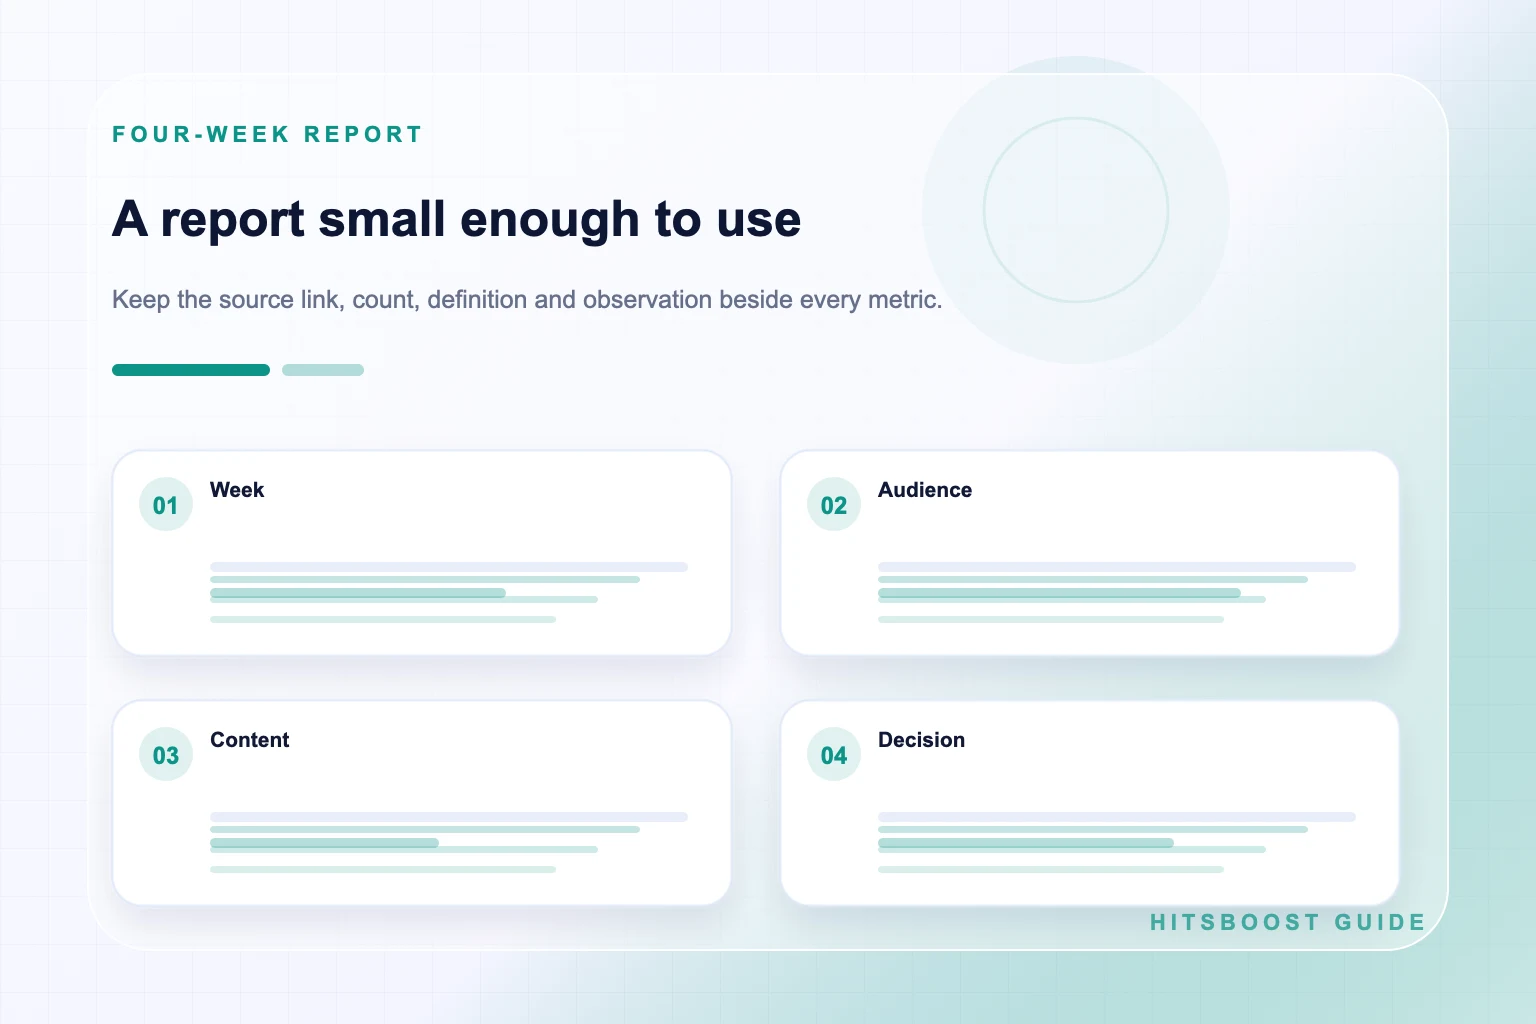
The first block names the Page, objective, dates, timezone, owner, and data sources. The second shows audience starting and ending values. The third lists publishing, distribution, response, and viewing highlights with links to the underlying content. The fourth shows traffic and verified business actions. The fifth records context, limitations, conclusion, and one next action.
Use plain labels and preserve raw values. A chart can help a reader scan change, but it should not replace definitions or hide missing periods. Add footnotes for rounding, unavailable figures, formula changes, or interface migrations. If a metric disappears or is renamed, begin a new series or explain the break rather than drawing a continuous line across incompatible definitions.
Design the template for the next reviewer, not only the person building it. A colleague should be able to open the links, find the source values, repeat a calculation, and understand why the team chose the next test. That reproducibility is more valuable than a decorative dashboard full of unexplained scores.
- Observation: what the source displayed during the period.
- Context: what the Page published, promoted, changed, or experienced.
- Interpretation: a plausible explanation stated with its limitation.
- Decision: one improvement, owner, deadline, and next measurement.
Run a weekly review and a deeper monthly decision
In the weekly review, check data completeness, record audience values, list new posts, and identify operational issues. Note one content observation and any important audience question. Keep the meeting short and correct broken links, missing tags, unanswered messages, or reporting gaps quickly. Do not redesign the entire strategy because one post was unusually high or low.
In the monthly review, compare full periods and several content examples. Examine audience movement, publishing consistency, distribution, response quality, video behavior, traffic, and business actions. Write what the evidence supports, what remains uncertain, and which alternative explanations matter. Select one or two changes the team has capacity to execute.
If a follower package is part of the plan, record its public destination, tier, quantity, price, dates, receipt, and provider status separately. Compare the follower count under its proper label, then continue reviewing organic content and business outcomes independently. A package cannot guarantee reach, reactions, watch time, leads, or sales, and the report should never imply otherwise.
Explore Facebook FollowersFrequently asked questions
What should a Facebook Page growth report include?+
Include the Page and period, audience counts, publishing activity, distribution, content responses, video viewing, traffic, verified business actions, context, limitations, and one next action. Keep each metric's definition, source, and destination visible.
How often should I measure Facebook Page growth?+
A weekly operational check and monthly decision review are practical starting points, not platform rules. Use checkpoints that match the campaign and compare complete periods of the same length and timezone where possible.
Is follower count enough to measure Page growth?+
No. Follower count describes one audience measure. Add content response, video behavior, traffic, and verified outcomes according to the Page objective. Keep those layers separate instead of blending them into an unexplained growth score.
How do I calculate Facebook follower growth rate?+
Subtract the starting follower value from the ending value, divide the difference by the starting value, and multiply by 100 when the starting value is above zero and both counts are comparable. Save the raw values, dates, source, and rounding limitation.
Which Facebook engagement rate formula should I use?+
Choose the denominator that answers the stated question. Interactions divided by followers relates response to audience size; interactions divided by reach relates response to reported exposure. State the included interactions and use the same method for comparisons.
How should I report Facebook video growth?+
Report views, watch duration, completion or retention, interactions, and outcomes separately under their current definitions. Include the direct video link, length, format, date, and promotion context, and compare reasonably similar content.
Can a report prove what caused Facebook Page growth?+
A timeline and before-and-after values can show sequence and correlation, but several activities and outside events may overlap. Use causal language only when the evidence supports it; otherwise, state the observation, context, plausible interpretation, and limitation.
Compare Facebook Followers packages.
Prepare the public destination, then review the quantity and terms that fit your goal.
Compare Facebook follower packages